What I Learned from Studying Mathematics

When I tried to write my “math autobiography” before, it didn’t go well. Looking at the past, I am not sure how I felt about the subject and what experiences made me abandon it for almost twenty year.

I was born in USSR, Kazan, and started my education in German bilingual school. I was obsessed with academic performance: I remember having a complete meltdown when I got A instead of A+ in German in grade 2. I also remember I loved math in elementary, but I am not sure if it’s because I loved the subject or really liked the teacher. So I eventually got the reference to the Junior High Mathematics and Physics school affiliated with the Kazan State University. I had to write an entry exam; I ended up with high enough score to get in. I don’t have good recollection of my time at this school as I suspect it was when the teenage years had hit me, and school suddenly stopped being a priority it once was. I vaguely remember something about 3D coordinate system and vectors. Also, I loved algebra. But math was suddenly hard and all the effort didn’t seem to be worth it; I lasted 2 years.

In the meantime, Soviet Union collapsed and the education system went wild. New schools and Lyceums were approved and opened on every corner. I have moved to a humanities school where I studied Latin, history of art and architecture, international literature, philosophy… I did not have to take any high school math: there was a general math/science course jumbled together which I would now define as lacking rigour, content and structure. Or maybe there was rigour, content and structure, but I don’t remember it – it happened couple of times a week anyways.

In the next 20 years, I spent two years studying linguistics, got Masters in Philosophy, moved to China and learned Mandarin and English, moved to Canada and got a teaching degree, and finally, five years ago, ended up teaching grade 4 in Calgary. When I looked at the Program of Studies, I realized I don’t remember how to do long division. Then I suddenly realized that math is becoming the subject I love to teach. So I thought I might again love to learn it.

I watched this video that I found on Tracy Zager’s companion website to her book Becoming the Math Teacher You Wish You’d Had. It made me sad and angry at someone, I don’t know who. I thought that I am walking around with a blindfold, and a big aspect of the my life is hidden away from me because I never bothered to look. I enrolled in Introduction to Calculus online for-credit university course.

My exact thoughts were: How bad a first year university course can be? Well, as I found, for someone with my math background it can be crushing.

Important things I believe have made me a better teacher:

  1. When I read twitter/blog posts about how intuitive and easy math should be it makes me upset, because it isn’t easy for me. “It’s easy” in the classroom is painful. “It’s easy” anywhere is painful, with best intentions.
  2. I am that kid with “crazy gaps in my background knowledge”. I do need to identify and work on the gaps. I will be stuck if I don’t address this. So are my students.
  3. I cried, and not once. I threw my notebook against the wall yelling that I’m stupid. I believe, I have a positive mindset and enough grit. My students need to have a way out when they feel that their struggle is destructive, because it can be. I should never dismiss their tears. How can I offer them a way out of a stressful situation without offering a way out of math?
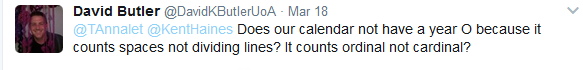
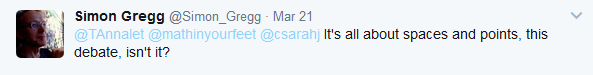
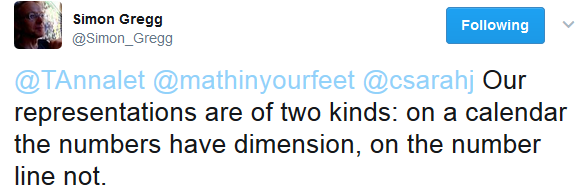
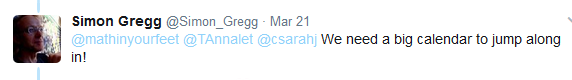
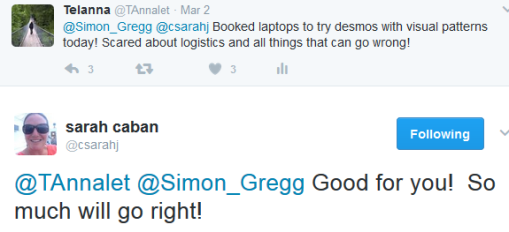
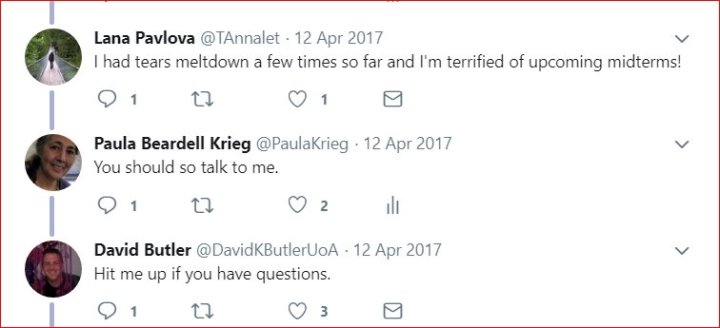
  4. I would have never made it alone. I complained into the twitter space that I am about to quit my Calculus course. Paula Krieg told me to “talk to us”. I can’t find a tweet but it really made a difference. I want to thank David Butler, John Golden, Amie Albrecht , Sarah Caban, Brian Penfound , Simon Gregg and all #mtbos who helped me to make it through.LPdkatnT

Today I wrote my Linear Algebra final exam, and I am now enrolled in a program that will take care of entertaining me with the math courses for the next 3-4 years. The most important thing I learned from studying mathematics is that when I needed to talk to someone, I found a community. Thank you, #mtbos. Now, I need to make sure I create this community in my classrooms.

Troubles with Triangles

Trouble with Triangles 1

Questions to consider before reading further.

  1. What is the perimeter of a triangle with the side lengths of 6.4, 2.9, 3.3 units?
  2. Make as many triangles as you can with a perimeter of 12 units (integer value sides).

Yes, the first is actually an impossible triangle and the second question doesn’t have as many solutions as many elementary students believe it does. I have asked the second question in multiple  grade 3-6 classrooms this year. So far, there was one student who was able to immediately identify that 10-1-1 triangle is impossible. Triangle inequality theorem is not a part of elementary Alberta Program of Studies for mathematics. Why do I believe it is important for students to realize that not all combinations of numbers can describe triangles?

tri1

tri2

For me, it comes to the goals of our geometry lessons. There are countless worksheets around the internet that ask students to add the values of the sides to find the perimeter. How often do students have an opportunity to visualize these numbers and make sense of them?

When I asked grade ¾ students to work on the second triangle question (finding all possible triangles with the perimeter of 12, whole number values), there were some interesting answers: 6×2=12 and 4+8=12.

“Can you draw this triangle and label the sides?”

“I don’t want to draw, I can do multiplication and it is faster”.

“How many sides does a triangle have?”

We have used a paper strip folded into 12 equal sections. A challenge of paper was that the students tried to push the edges together. Some were unconvinced that 6-3-3 triangle is impossible because “you can pull these a little closer”.

Marilyn Burns and Mike Ollerton suggested Cuisenaire rods for exploration.

twitter1


Simon Gregg mentioned matches and created a beautiful Cuisenaire summary of all triangles with the perimeter of 21.


Upsilon fan shared gr3 investigation

twitter4

My colleague Nicole who teaches grade 1/2 in Calgary, started with asking students to build the triangles with Cuisenaire rods and count the length of their perimeter. I wonder if before posing perimeter questions it is useful to explore triangles freely, build them with different sides and connect the constructions to numbers. Students in her classroom have also built triangles with the length of each side that equals 10 (with the purpose of practicing the “friends of ten”).


Trouble with Triangles 2

How can we find the sum of the angles of different polygons?

tri8

I picked this question for the similar reason as the first one: I hoped that it will give students the opportunity to notice patterns in shapes, to use these patterns to figure out what we don’t know based on what we know, and to consider how the numbers that describe the shapes (angles) can be used to make generalizations. Students have already learned that the sum of the angles of a triangle is 180 degrees. Many were aware that the sum of the angles of rectangles is 360 degrees, but they did not extend this rule to the quadrilaterals with non-90 degrees angles.

I started with drawing shapes on the board and breaking them into triangles until someone said they know the rule I use to break the shapes. We had fun breaking the shapes (“you got my rule” – “you didn’t get my rule”), until we settled on some guidelines: straight lines from one vertex to another, no intersections, shapes are broken into as many triangles as possible. I left the students at that being very determined to not spoil the work. Besides a couple of students, everyone was stuck, so I had to suggest to draw a few shapes, break them and see if they can notice any patterns. It was interesting to see how “let’s just try things and see if we can notice some regularities” helped students to get on the path to the solution. By the end of the lesson, most of the students were able to notice the relationship between the number of triangles and the number of the sides of the polygons. Looking for the patterns and conjecturing about them was the most difficult part of the work.


Questions and Thoughts

Geometry in elementary provides many opportunities to get students into the habits of mathematical reasoning: generating data, looking for patterns, making conjectures, testing, proving, refining and communicating them. In my previous years, if I connected measurement to geometric properties, it was usually in a descriptive (the edges are the same length), not a problem-solving context . I wonder how we can make elementary school geometry more about describing relationships than describing only objects. And how do we find questions and problems that can help to explore the relationships between the shapes as visual objects and numbers that describe them? Until now, I have been stumbling upon these questions, but I want to be more intentional about them now.

I also hope to recognize when students ask the questions that have the potential to explore these connections. Here is one from my last year grade 3 student: What is the smallest number of faces a polyhedron can have?

20170504_163539_resized

20170505_160754_resized

20170505_160455_resized

20170504_163637_resized

Polygon is a Shape That is Really Big

I am trying to de-unitize my grade 5 math curriculum this year. As we are reviewing subtraction, looking at visual patterns and exploring arrays, we also work on building vocabulary and precision in describing and classifying shapes. We started with a Which One Does Not Belong? board which is the permanent setup now in our hallway with regularly changing prompts.

wodb

Rope Polygons: Body-Scale Exploration

Last Friday, I decided to implement a Rope Polygons lesson from Whole-Body Math Lessons developed by Malke Rosenfeld. I was hoping that my students will have an opportunity to refine their understanding and to develop their vocabulary by working collaboratively; communicating with each other should create a need for more precision and justifications. Malke shared a very detailed lesson plan here.

After students investigated the ropes and noticed the knots, I asked them to create as many regular polygons as they could. Eventually, all the groups started using the knots and created squares, triangles, hexagons. I moved some students holding the vertices of a square apart, and they informed me that it is not a regular shape anymore but struggled to explain why. A few mentioned angles.

After half an hour of building, I asked my students to reflect on the activity. What strategies did they use? What helped them to be successful? What were the challenges? And how would they explain what regular polygon is to someone who doesn’t know? Give me the definition.

Definitions: Polygons Are Big

Here are the (non-exhaustive) list of definitions I was surprised to read after school.

A regular polygon is a shape that has edges.

A regular polygon is even.

A regular polygon is the shape whose angles are the same.

A regular polygon is straight line and symmetrical.

A regular polygon is like a square or triangle.

A regular polygon is the shape that has same perimeter and area.

Polygon is the shape with parallel lines.

Regular polygons have the same angles.

Polygon is the shape that is really big.

Students described all the properties that they noticed while building regular polygons with the rope, including the size. How do I zoom in on the defining ones?

Attack and Counter-Attack: Refining the Definition

I got the idea from the blog post Attacks and Counterattacks in Geometry by Sam Shah. There are still a lot of ideas in this post that I would like to try this year, like finding counterattacks for the altered textbook definitions. I made it into a whole class activity with students working on the small whiteboards.

We started with this example: “A circle is a shape that has curves. Counterattack! Draw a shape that fits this description, has curves, but is NOT a circle.”

counter7

Then we moved on to regular polygons. Here are some counter-attacks.

counter6
“Polygon is a shape that is really big.”
counter8
“A regular polygon has edges.”
counter5
“A regular polygon is even.” This caused some confusion and I asked students to interpret this to the best of their abilities.
counter4
“A regular polygon is like a square or triangle.”
counter1
“A regular polygon is straight line and symmetrical.”
counter3
“A regular polygon has parallel sides.”

We made a list of properties on the board. After each counterattack we had a discussion if this property applies to all regular polygons and if it is essential. I think I overdid it a bit with circling and crossing, so I pretty much had the definition on the board by the time I asked my students to go back and to revise theirs.

definition

Thoughts: What’s Next?

Something that naturally appeared in the discussion was “Never, Sometimes, Always” format. Regular polygons never have curves, sometimes are big and always have edges of equal length. I might pull a few statements for Talking Points (I learned about Talking Points here).  I’ve been thinking about Van Hiele levels. How do I support my students in moving from the shapes as objects of investigation to the properties of shapes?

I Might Need Help Getting Started

I have been excited and anxious about this September. It is my first year teaching grade 5. I am not sharing a room with another teacher this year, and I now teach all subjects like all elementary generalists are supposed to do. I spend less time teaching math, or rather I try to spend less time teaching math. Recommended time allocation is 25% for Language Arts and 15% for math. Can I add math journaling to 25%?

I spent a large part of my summer getting my head around grade 5 topics and outcomes and trying to plan. My google drive notes progressed from “Grade 5 Math Miscellaneous” to “Math Weekly”. For the first few weeks I tried to choose a range of activities that would allow me to set up norms and routines as well as get a sense of how my students solve problems and work with numbers.

Observations: Are You Good At Math?

On our first week, I asked my students to share with me if they think they are good at math, explain how they know, and tell me if other people know about their math abilities. Grade 3 responses last year revolved around calculations, but the majority of the students had good confidence about their math skills. Apparently, something changes by the time they reach grade 5.

good at math

good at math1

good at math3

good at math2

It sounds like some students are trying to give up already. Something to be mindful of.

Successes: Visual Patterns

I love starting a year with Visual Patterns: A perfect example of low floor/high ceiling routine. I get inspiration from visualpatterns.org and eventually move on using the patterns that students have created as prompts.

We started with these patterns.

Students created their own and used Desmos to graph them. I plan to continue working with patterns throughout the year. Building more patterns. Writing expressions. Building patterns for expressions. Checking their predictions with graphs.


Challenges: Subtraction

Grade 5 curriculum in Alberta doesn’t mention addition or subtraction of whole numbers. I guess the review is assumed though I wish it was explicitly mentioned. I wasn’t about to dive into decimals operations and multi-digit division and multiplication without ensuring addition and subtraction skills are ready. We started our number talks with subtraction strategies, but I also gave my students some questions to answer that would require them to use subtraction: a mix of word problems and pure arithmetic questions, spread around a few days. Here are some examples. What do you notice and wonder?

subtraction

subtraction6

I see a pretty vast range of different understandings of numbers, place value and operations.

  • Understanding of one-digit operations however without understanding of place value
  • Confusion with the algorithm
  • Understanding of place value however uncertainty how to apply this understanding to subtraction
  • Understanding the relationships between addition and subtraction
  • Flexibility with different subtraction strategies and confident understanding of place value

I tried to choose the prompts that would call for particular strategies like adding up or making friendly numbers. About 90% of my students chose to use the standard algorithm for all the prompts, and  50% were getting lost in it. Here are some strategies that students generated. Where do I begin?

subtraction poster

Closing Thoughts

It seems like the map of understandings is expanding the older the students get, and I find students in very different places. I wonder how grade 7-12 teachers manage to navigate it. How does differentiation look like in different classrooms? Yes, all my students were able to access visual patterns lessons at their level, but they all need to master subtractions skills as well. How do I support my students in getting access to the skills and problems that are currently very challenging for them and the challenges are different for everyone?

Smaller Than A Number

This post was supposed to happen after the school year was over.  At the end of the year, we spent the last 3 weeks talking about fractions, my favorite topic in grade 3 curriculum. I knew I needed something to keep me going in June.  Then the summer started. My memories are hazy now, but I’ll give it a try. Here are the highlights in (to my best recollection) chronological order.

The Cookie Fiasco

The Cookie Fiasco is a wonderful funny book in which four friends are trying to share three cookies. We read the first half, stopped and I asked my students to help the friends with the cookies. Apparently, they could get 1/2 and 1/4 or 3/4. Some students noticed that these must be the same. I noticed that while everyone was successful helping the friends, some students were calling any equal parts halves.

All About Fractions

After my students agreed that the friends had to use fractions to share their cookies fairly, I asked them to tell me all they know about fractions.

thought10

thought9

thought7

thought5

thought4

thought2

Some students also added their wonders.

We spent some time working on notation afterwards. And I asked my students to brainstorm what numbers are to see if fractions fit in. I don’t think everyone was convinced though. Yes, you can count them and they fit on the number line. But they are smaller than numbers. I am still unsure how I should have continued the conversation about fraction being numbers, or parts of numbers, or some new weird numberland creatures.

Number Talks Images and WODB

This image from Number Talks Images website appeared to be a great prompt, intriguing and accessible. My favorite solution: put all halves together, cut one corner watermelon into three quarters, and give these quarters to the other watermelons.

talk.jpg

Which One Does Not Belong helped to focus once again on the idea that the same fraction of the same whole can have different shapes.

fraction talks.png
From http://www.fractiontalks.com/2016/11/mtbos-connected-fraction-talks-and-wodb.html

Half of a Square

I love the paper folding challenge from youcubed website, and we did it this year again. I simplified it a bit. I asked my students to make a triangle that is half of the original square, a quarter of it, then make a square that is a half and prove it to their classmates and to me. “These 2 squares fit on top of each other, they are the same.” I tried to talk about Plato but the audience didn’t seem excited.

square

The Sad Bunny Story

Once upon a time there lived a lazy bunny who went to visit his friend owl. They had a sleepover, and in the morning lazy bunny was very lazy to go home. The owl suggested that the bunny shouldn’t push himself too hard. He should go half the way on the first day, half of the remaining way on the second day, then half of the remaining way again. How many days will it take for the bunny to make it home?

I don’t remember where I got this story but the scenario worked well for eight-year-olds. We modeled the first couple of days on the clothesline and did the initial estimation.

bunny.jpg

I offered meter sticks, strips of paper, poster paper, and then in a stroke of insight I taped a couple of number lines on the floor. We ended up getting together and doing a proving part on the large number line. “Three days? Can you show me on this line?”

bunny1bunny4

bunny extra

bunny extra2

My stories about Zeno were met with much more enthusiasm. Especially the Arrow paradox. My students did a bit of experimenting with throwing non-sharp objects to prove to me that they do indeed hit the target. “The Paradox!”

Clothesline Fractions

Building on our work with the fractions on the number line, I asked my students to put these fractions in order in their table groups, and then we discussed the order and found a correct place for each one. One half and two quarters caused a debate. “Can you have two numbers at the same place on a number line? Is it the same number or different?”

line.jpg

Quarter the Cross

I was really excited to try this challenge in my classroom. For the first lesson, I followed the lesson outline that David Butler described in his blog. I gave out the templates with the crosses, my students sketched down some ideas, did the gallery walk, shared a few with the class, and then everyone had another try.


I’ve decided to end the year with the quick art project. Quarter the cross. Same fraction. Different shape. Two colors.

art5

Questions and Thoughts

I wonder at which point fractions stop being a wonderful new mathematical concept and start being frustrating and challenging. Is it when students need to start adding, subtracting, multiplying and dividing them? Is there anything I can do to prepare them for this? What intuitions would be helpful?

I Am Good at Finding Patterns

The end of the school year is usually an emotional time for me for a multitude of reasons: some students who I never reached, some personal goals unaccomplished, curriculum not covered, rushed lessons, unfinished conversations, the workload doesn’t fit into 24 hours day and “my kids” are about to disappear into the summer. So this post is not about a lesson or a series of lessons, it’s about emotions and perceptions.

Introduction

As the school year is coming to an end, so is our Mount Holyoke College Course. During the most recent session with Kaneka Turner, she shared her call to action with us.

  1. Interview a set of student you serve using the following:
  • Are you good at math? How do you know you are? are not?
  • Do other people know you are good/not good at math? How do they know this?
  • Is there anything about math class that causes you to be good/ not good at math?
  • If you could change one thing about math class what would you change and why?
  1. Consider the results of this interview and the implications for your math classes.
  2. Plan to or actually make 1 change as a result of the results.

I decided to start with taking two questions and asking my fifty grade 3 students to write an answer. I told my students that I need critical feedback so me and other teachers can be better math teachers, and I trust my kids’ honesty.

Question #2 (we are moving backwards):

If you could change one thing about math class, what would you change and why?

There were some interesting ideas, but a found that a lot of the answers were very personal and focused on what students find hard or easy, and then they want things to be either harder or easier.

Students want: more problems, more time, more division because multiplication is too easy, more geometry, more multiplication bingo, more Desmos, word problems instead of “just numbers”, learning more strategies, harder, easier, more times tables because I know them, more tests.

Students don’t want: subtraction because it is too hard, multiplication because it is too hard, too hard math, too easy math, no standard algorithm, no tests.

This was all alarming, but it wasn’t the worst.

Question #1

Are you good at math? How do you know?

Most of my students felt they are good at math. And they should. But the reasoning stunned me.

Some responses I hoped to get more of.

  • I am good at math because I am good at finding patterns.
  • I am good at math because I can find patterns.
  • I am good at math because I know good strategies and know how to use them efficiently.
  • I re-think what I learned when I get home.
  • When I get to solve problems it’s actually kind of fun!

That’s it, five responses, the rest I hoped I wouldn’t get.

  • I am not good at math because I don’t understand how standard algorithm works.
  • I am good at math because I learned division and multiplication before grade 3.
  • I’m ok because I am good at adding but subtraction is confusing.
  • I am kind of good because I remember my times tables up to ten.
  • I am good at math because I can times big numbers.
  • I am good at math because I am fast at multiplying and also correct.
  • I am good at math because I can add, subtract, multiply, divide and my brain works fast and smart.
  • I am good at math because I get more answers correct.

And the nail in the coffin.

done and over

Emotional moment # 1

I went through…

Denial: They didn’t understand the question. They just tried to give the “right” answer.

Anger: Why didn’t they get it? All year was for nothing!

Bargaining and looking for excuses: If only program of studies didn’t put that much emphasis on numeracy in elementary. I only have one outcome for geometry and two pages for operations. If only I have asked these questions earlier.

Depression: I am a terrible teacher and now it’s too late to do anything. I failed at one thing that I believe really matters. I’ve been leading workshops about math teaching all year and I’m a fraud. I’ve ruined my students’ math education and they will hate math for the rest of their life.

Acceptance: Now, what can I do about it? Because I can’t just leave it.

Continuing the Conversation

We started by getting together with all fifty kids and my teaching partner and brainstorming what it means to be good at reading. I hoped to get a T-chart and compare reading and math. We did make a T-chart, but a result was surprising. What do you notice if you compare this chart to students’ personal responses?

tchart

I noticed that there were more answers that I expected to get in the first place. Were my students just telling me what they knew I wanted to hear now? Did they get more ideas from each other? Whatever it was, my original plan to compare and contrast it with reading was not turning out to be dramatic enough. We noticed similarities.

Then I asked my kids what we did in math this year. They told me about addition and subtraction. I put it on the board and circled it. And then we kept going. We kept going for a while, and when the bell rang I asked the students who still had more ideas to add them on the post-it notes. Here is what we came up with.

board

And more from the notes: Is 5 closer to 0 or to 10, patterns in a triangle, polydrons, odd and even numbers, egg experiment with weight, paper (cardboard) SOMA cubes, multiplication gummy bears, Euler’s formula and making geometric shapes.

After lunch, I asked students to look at everything we have on the board, on the ideas on the post-its, and put a thumb up if they felt successful at something, did good at it. My students are used to showing the number of strategies they came up with on their fingers, so I saw how more fingers were following the thumbs, kids reminiscing on the year of math and counting their successes. They were beaming. Two girls quietly moved to writing more questions.

Questions

Emotional moment # 2

I told my students that I am writing their report cards now and no one is getting any 1s, and if they worry about it they shouldn’t. I told that asking good questions is sometimes more important than getting right answers. I told them how I’ve been sharing their work with other teachers who always said what amazing mathematicians they are. I stopped because I realized my rambling might actually spoil the moment. I left all their notes on the board. I want my students to keep seeing it and thinking about their successes. I want them to remember that arithmetic is just one thread in the math tapestry.

Final thoughts and questions

I am glad I did not just end my year with the assumption that I know what is going on through my students’ heads as they enter and leave my math classes. I still wonder what I did wrong, what I need to change next year so that my students have this realization about the nature of math as a subject earlier than May. I wonder if something in my words, my lesson design was reinforcing the stereotypes. Do my words and my actions and choices always align? I realized that I want to change how my students feel about mathematics, I need to explicitly design my lessons with this goal in mind. I need to be more careful and more reflective.

I wonder what’s one thing I should change in my math class?

I live on Hepta-Shape street

There has been a lot of conversations about disciplinary literacy in recent months in my  professional learning circles. The intent is sometimes going in strange directions in math class towards keywords in word problems and being “ok with writing just to write”.  The whole “incorporating reading and writing into the math class” treats the matter as if reading and writing skills are somehow not intrinsic to math and have to be dragged in forcefully.

There is a lot of reading, writing, questioning, inquiring and thinking critically that absolutely has to happen in a math class for students to learn math in a meaningful way. And I also think that often math topics can lead into some great creative writing, art and discoveries across the disciplines. This post is about the latter.

I have blogged extensively about my geometry lessons this year (here and here). I am working with an amazing teaching partner this year, who is taking care of the language arts teaching part of our fifty students’ community. Working with Megan allowed me to regularly cross the imaginary boarders between the subjects without any teachers being hurt in the process. She developed and implemented the writing/reading part of this polygons project.

Polygons Pen Pals

Students have been exploring, classifying and creating their own polygons from tangrams. I noticed some started drawing eyes and hands, and that’s how the project was born. After identifying the properties of their polygons, students gave them names and considered their personalities and life stories.They wrote letters to their unknown polygon pen pals, and next week we hope to exchange the letters and to write responses. I will leave the rest of this post to my students’ work.

SKITTLES

Poly10
I’m Skittles Decagon. I have 10 soft/fluffy/straight edges, 10 pointy sharp vertices like a sword that’s sharpened. My hobbies are catching mice for dinner and breakfast, reading cat history books and I play catopoly on Monday and Wednesday. What are your hobbies?

LARRY’S SWORD

Poly11
I am a polygon from the dragon slayer realm and I used 7 stones/tangrams to build myself. My favorite food is poutine because the fries are mushy, soft and salty. My favorite drink is Mountain Dew because it is sweet and fizzy like Coca Cola and ice tea at the same time.

LARRY

Poly12
Hello, my name is Larry Decagon from Royal Arena. I am infinity years old because my mom, the Witch, revives me from death every 50 seconds. I am dying all the time because I am always fighting in the royal arena.

SHIRO

Poly5
Hello, my name is Shiro Pentagon. I look like a regular quadrilateral with a triangle on top.  I like cats, every candy, a game called ROBLOX, acrylic art, writing with different fonts, friends, traveling and dancing. I also have a cat named Kanto. He enjoys getting dressed up in tiny handmade outfits!

LARRYO

poly3
I am a hexagon with 6 pointy vertices and 6 straight edges. I look like a heart. Some likes that I have are toys like hex bugs, sports like soccer, activities that are outside and movies that are comedy. What likes do you have? I wonder will the earth come to an end.

BOB

Poly2
I’m not a normal shape because I am concaved. I don’t like annoying people because it distracts me. I like doing experiments, building structures and shapes. I won the science contest last year at my school. When I’m bored, I read a book.

LINDSAY

Poly9
I live in a farm in the middle of Japan. I am a triangle. What I like about Japan are the Cherry blossom trees. I am a convex shape and I have one right angle. I am also a 2D shape which means I have one face.

CENAMAN

Poly8
I like parties and I am always wearing a hat. I’m clever, agile and creative. I don’t like loud people at all. Do you like loud people? Some people call me a monster because I have a big mouth and sharp jagged teeth.

QUAD QUADRILATERAL

Poly1
I am a convex shape because I have no edges that are inside. Are you convex or concave? I am a regular shape because all my edges are equal. I like resting during the winter because it is nice and cooling and moving during the summer when there aren’t many obstacles. Autumn and spring are usually equal because the temperatures are very similar.

KASEY

Poly6
By the way, what do you want to be when you grow up? I know what I want to be. I want to be a shape nurse. Because you can heal a lot of shapes and polygons. I like meeting new people. I also like going to the library and school.

Thoughts and Questions

I know that students enjoyed giving “life” and stories to their polygons.  I admit my worries that it might have been a superficial connection. There was no mathematical need for written communication and there are still many questions that I wonder about.

Did moving towards creative writing still support my students’ mathematical thinking in some way?

What is the value in putting mathematical objects and relationships into non-mathematical context?

Months later, my students keep bringing up our infinity art/writing/reading lessons; they keep asking mathematical questions and making mathematical connections. My students spent time thinking about dragons and favorite food of their polygons, but they were also very careful  making sure they identified their polygons’ “physical” features correctly. Mathematical context created motivation for creative writing which in turn created motivation for mathematical precision. Maybe we do need the whole range of experiences to make sense of the whole range of things and our literacies can be a bit more interdisciplinary.

Where does the number begin and end?

Look at your hands and your fingers, 1 to 5 on one hand and 6 to 10 on another. Doesn’t it look like 5 might be closer to 0? It wasn’t anything I contemplated recently until my students brought it up during Open Middle/Clothesline math session. Make a number that is closer to 200 than 300. Where is 250?

“I think, it is closer to 200, because you count 250 first.”

“Because a teacher told if it’s 50, you round down.”

This made me pause, “What about numbers from 0 to 10, Is 5 closer to 0 or to 10?”

“Closer to zero.”

“Raise your hand, if you think it’s closer to 0.” – More than half of the hands go up.

I did not expect this at all.

“I am not sure. Is 5.1 still 5? Where does the number begin and end?”

Developing the Question and the Claims

In the next few days I’ve been obsessed with this question and with the possible ways to approach it, and I think this question made it into most of the twitter chats. Kent Haines wrote about the rounding conversation in his blog.

In another conversation about natural numbers,  David Butler pushed my thinking in an unexpected direction when we started talking about calendar.

David Calendar Super Important

I wondered if that might have been the reason for my students’ uncertainty. Ordinal and Cardinal number duality causing a lot of confusion!

I was trying to figure out how to approach it when Malke Rosenfeld’s book, Math on the Move, finally arrived in the mail. The next day, I made four large number lines on the floor of my classroom.

Students explored the line in groups to test their ideas and to discuss them.

S: “You start here (points at 0), you count 1, 2, 3, 4, 5, 6. But when I go to 10 if I count from 5, it’s 1, 2, 3, 4, 5.”

Me: ”Why does it change?”

S: “You don’t count 5 because you already counted it.”

Me: “Do you count your starting point?”

S: “Yea.”

Me: “So what happens if you count from 10?”

S: “It will still be 5!”

Me: “Try it.”

S: “1, 2, 3, 4, 5.. (stops)…. 6? It changes. When you walk up, 5 is closer to 10. When you walk down, 5 is closer to 0.”

We were thoroughly confused.

This time, Malke Rosenfeld, Sarah Caban, Simon Gregg and Kristin Gray joined the conversation and shared some ideas on using kid-sized math tools. The calendar also reappeared.

Simon Calendar 2Simon CalendarSimon Calendar 3

I didn’t want to stop just yet. The discussions were great, and I was looking for some structures to prompt students to verbalize their conjectures and to listen to each others’ arguments. After the recent online session with Kristin Gray at Mount Holyoke College, I’ve decided to start with the Talking Point and this time limit it to one statement to focus our conversation. Talking points helped students to find like-minded peers to do more proving together.

Developing Arguments and Revisiting Claims

We ended up making four teams as there was always one more popular claim. Each team got their own large number line and any other manipulatives or measuring tools that they could find in the classroom. Our most popular choices were meter sticks, snap cubes and balances. I also handed each group a set of cards with numbers 0 to 10 and some tape to arrange their numbers on the number line when and as needed. Some added fractions. Some took rulers to be precise.

NL4

Groups presented to each other and asked questions. Many students changed their opinions in the process.

reflect change idea

Counting Argument: Five is in the middle.

argument, one not zero

S: “You go 1, 2, 3, 4, 5 then 1, 2, 3, 4, 5.”

Me: “Do you count zero?”

S: “No.”

Me: “Why no? Shouldn’t you?”

S: “You don’t count zero because it’s a number that you don’t use in counting.

Semiotic Argument: Five is closer to zero.

argument 1
“Zero is one digit and ten is two digits. And five is one digit. So it would be closer to zero than to two-digit number.”

Calculations argument: Five is in the middle.

Change argument: It depends.

argument, it changes
“It shifts when you count from different sides.”

Snap cubes argument: Five is in the middle.

“The number of blocks between zero and 5 is 4, and the number of blocks between 5 and 10 is also 4. The number of blocks stays the same so it is the same distance.”

Hotel argument: Five is in the middle.

hotel argument

“Say you wanted to stay for 5 nights and then go to a different hotel for 5 more nights. And then you leave. Days are spaces and nights are numbers.”

In my final move, I asked students to take the numbers away, then find the middle and stand there. Then together we put the numbers back. Five was landing on the middle spot. We proceeded to our journal reflection.

reflect1

reflect9

argument, number line

reflect6 hard to pick

reflection uncertain
Some students are still uncertain.
Reflect not convinced
And some are unconvinced.

Closing Thoughts

This question appeared to be much trickier than it sounded at first and it brought forward more questions. What is the middle? Are numbers “spaces or points?” Are fractions numbers? How do you count? Do you count zero even if it is nothing?

Actual Answer

I thought about a difference between the models of number line and a hundreds chart. I never considered that essential difference before. I wondered if developmentally ordinal understanding of numbers comes  first and it is a an abstraction leap to the cardinal numbers. I also wondered about historical development of number concepts and at which point numbers stopped being counters. My twitter and classroom conversations made me think about our zero-less calendar. We count years, days and months as they begin. Our whole calendar system is based on the intuition of ordinality. Zero is hidden in the moment of midnight, too dark and fleeting to count it.

And a large number line is a keeper.

large number line

I Noticed a Pattern in My Pattern

Introduction

“What is a pattern?” – “It is when something is repeating like ABAB.” I found at the beginning of grade 3 that my students could build repeating patterns. We’ve been working throughout the year on identifying rules in increasing and decreasing numerical and visual patterns, and I wanted to find a way for all this scattered practice to come together.

The credit for the idea goes, yet again, to Simon Gregg  who shared how he used Desmos with his students to graph the visual patterns they created. He shared his blog post with the details of the lesson and students’ work. I wanted to adapt it for my classroom and I hoped that my students would notice the connections between the model, the symbolic numerical representation and the diagram/graph.

Questions and Thoughts: Before

I was anxious about the logistics of the lesson. Thank you, Sarah, for moral support!

twitter


Will everyone be able to build an increasing pattern?

Will all students identify which step is which when translating the pattern into the table?

If we work in math journals, will someone spend an hour creating a table to fill out?

Will the students be able to handle the technology part independently?

Preparing for the Lesson: Getting Ready to Make a Pattern

I used one of the three-act math prompts from Graham Fletcher’s website to get students thinking about the growing patterns. After watching the video, I asked my students to build steps 4 and 5 of the pattern, label the steps and the number of tiles in each step and write down the pattern rule. Then students had to figure out how many tiles would be in step 10 without building or drawing all intermediate steps. This part has gone smoothly enough to proceed to the next lesson.

Preparing for the Lesson: Getting Ready to Make a Table and a Graph

Many of my students used the table to organize the numerical information about the pattern to find the number of tiles for step 10. We created and extended the table together with the class. I decided to use teacher.desmos.com to utilize the dashboard feature that would allow me to keep track of the students work and to bring it on the interactive whiteboard for future discussions. Here is the activity screen I used to for my lesson. We graphed the pattern together and discussed the behaviour of the graph.

The Creation

The lesson went much smoother than it did in my nightmares. I made a table template to simplify the logistics. Most of the students were successful in creating an increasing pattern that follows a specific rule. Some students created patterns that were increasing, but they needed support to identify that their rule was not consistent.

table-inconsistent
There was often a “break” in the rule between step 1 and the rest of the pattern.
pat16
Some patterns had obvious visual rules but were tricky to represent in a table.

While most of the students worked with addition, some students tried to triple or double the number of cubes they use in the pattern.

Pattern 1: A Pyramid

Pattern 2: A Fire

graph1

Pattern 3: Plus Four

Pattern 4: “It’s a bit up and down but still increasing.”

pat15graph4

Students had some great notices and wonders.

noticewonder1

noticewonder2

noticewonder3

noticewonder4


The really exciting things started happening when students crowded around the interactive whiteboard and started analyzing their own and each others’ graphs. Someone noticed that if there is an unusual change in behaviour in a graph, there might be a mistake somewhere in the calculations. One student said, “If the number of cubes is the same on every step, I think the graph will be just the straight line, not tilted.” Someone else asked, “How can you make a circle if there will be more than one Y for one X?”

I had a moment of insight.

Making Predictions

During my lunch break I threw together my template for the afternoon reflection which included three questions and three spaces for the sketches.

-Without numbers, sketch how the graph of your increasing pattern looked like.

-Sketch how you think a graph of a decreasing pattern might look like.

-Sketch how you think a graph of a repeating pattern might look like.

I asked students to try and explain their intuition.

sketch3

There were a few interesting ideas considering the behaviour of the graph of a decreasing pattern.

decrease6.PNG

Many students tried to look at the graph differently rather than switching the direction of the slope. As if they re-located their point of view rather than changing the orientation of the graph to represent the decrease. I wonder why and I currently have no explanation.

decrease5

This reminded me of a graph of an absolute value function, and it seems to me that the student’s logic was also describing something similar.

As expected, repeating patterns had the largest variety of predictions. Most of the students went with the equally spaced bumps. A few sketched a graph of a constant.

repeat2

There was an attempt to express a repeating pattern as a periodic event.

repeat6

And I need to ask some questions about this graph: How far do you think these lines can go up and down?

repeat1

Questions and Thoughts: After

My students need more Desmos in their lives. The interface appeared to be 8 year old friendly. I did not need to explain anything about the coordinate grid. I think, if we try graphing decreasing patterns, there will be more clarity about the structure. I loved the teacher dashboard with all the functionality of tracking my students’ work and the ability to pause the lesson and to control the slides. I would love to have the function to print students’ work from the dashboard implemented because printing 50 clipped screenshots was somewhat time consuming.

I wonder if showing all three steps of the process before engaging with it pushed many of my students to work numerically rather than visually. Many of the students were just building the “rods” with the cubes instead of going for more creative shapes. Would the outcome have been different if I asked them to build the patterns first, took the pictures, and then introduced the next two steps? If anyone tries, please let me know how it goes.

I also wonder what my next step(s) should be. I am considering giving kids their graphs and pictures of their patterns and finishing their notices and wonders first. Some of the students wanted to test their predictions for decreasing and repeating patterns. Some started experimenting with creating pictures with their lines. I am also thinking about reversing the process; giving my students a graph and asking to create a table and to build a pattern. We will start with wonders and then I will make my decision.


Shoelace That Makes Life Harder

Introduction

When I started teaching grade 3 last year, I printed out the Program of Study and went over it with three different colors highlighters. One for the concepts introduced or explored deeper in grade 3, one for the numeracy skills my students need to master (e.g. subtraction of three-digit numbers), and one for applications (measurement, data analysis and representation). Oftentimes, I intentionally integrate my “applied math” lessons with other subjects, sometimes the need to measure something arises in a context. I try to be sensitive to these contexts to catch the teachable moment and to turn it into a lesson. Last week, we ended up learning about measuring length.

title

Tuesday: Counting

About a week ago, Christopher Danielson wondered about one of his prompts for his future book How Many? How many shoelaces will the students see, two or four?

shoes-box-open-2.jpg
Image from talkingmathwithkids.com

On Tuesday, I gave the prompt to my class; we noticed, wondered, and counted everything from shoelaces to letters on the box, to dots inside the shoes. It was wonderful. One girl said, “I have these kinds of shoes at home, I’ll bring them tomorrow and we can check how many shoelaces are inside them.” I said, “Sure”.

After school, we had another Mount Holyoke College session, this time with Dan Meyer. The big question from the session: Can you involve your students in the co-development of the activity, rather than just assigning it? I didn’t have an idea yet, but it put my mind into the “search” mode.

Wednesday: Estimating and Measuring

The girl handed me her shoes first thing in the morning. We were about to take the shoelaces out, when someone asked, “How long are the shoelaces?” This was perfect!

shoe1

Here is the Outcome from Alberta Program of Study Mathematics:

Students will demonstrate an understanding of measuring length (cm, m) by selecting and justifying referents for the units cm and m, modelling and describing the relationship between the units cm and m, estimating length, using referents, measuring and recording length, width and height.

First, we recorded what else we might be able to measure: shoe size, width, weight, how tall the boots are. We discussed what units we need to use to measure the shoelaces. The moments like this I appreciate that I teach in Canada and I don’t need to figure out Imperial units. I brought in the meter stick to use as a referent point.

Then, we gave our too high, too low and just right estimates.

shoe3


After students used post-it notes to give their just right estimates, they tried to figure out the length of one shoelace by measuring anything they need to measure without taking the shoelaces out. Someone asked if they could use the rulers. “Yes, if you think it’s helpful.” The math notebooks were used to document and explain students’ thinking and to write down their final estimate. Some students tried to get the answer out of me. “I have no clue, these aren’t even my boots.”

firstshoe3

firstshoe5

firstshoe7


The reveal was truly grand with lots of cheering and jumping. The shoelaces had the total length of 125 cm! We put some estimates on the number line to see who managed to get the closest estimate.

measure

shoes4

We discussed the possible sources of error.

-”Shoelaces go inside the holes.”

-”Centimeters are different on different rulers.”

-”Everyone was touching the shoes, pulling and stretching the laces.”

-”Some people would start a little bit ahead, not at zero.”

We had to pause for a discussion of “centimeters are different” to compare personal referents to standard units of measurement.

Then I had another moment of insight. “Let’s have a challenge. We can measure the shoelaces in my boots on Friday.”

Friday: Challenge

Here is why it was a “challenge”. What is your estimate?

shoe5.jpg

When my students saw my boots they looked at me like I am a magician who just pulled a rabbit out of a top hat. We went through the same routine, but this time we had a new referent point. The knowledge of the length of our Wednesday shoelaces. I honestly had no clue again how long the shoelaces might be, and my own estimate was quite a bit off.  I loved the range of the strategies that my students employed to support their problem-solving.

secndlace2

shoe7

secondlace1

secondlace7

Saturday: Thoughts and Questions

I do estimation challenges with my students somewhat regularly. They know the routine which is helpful when your audience is eight years old and the logistics can interfere easily with the flow of the lesson. Dan asked us to think about the verbs in our lessons. With my students, we noticed, wondered, selected tools, compared, modeled, estimated, discussed, measured, and some of us jumped and made not classroom appropriate sounds when our estimation was close. Most of us came up with reasonable answers, and all of us tried. Some students estimated that the shoelaces in my tall boots will be shorter than in student’s boots. I had to explicitly point at it for them to notice the disconnect. I wonder what I could have done differently to encourage them to make sense independently. I think that during our next estimation, we should have spent more time comparing our strategies and reflecting on our work.

I have previously done one week estimation challenges and I am considering bringing this format back . I would introduce the challenge on Monday and do the original estimation,(usually some kind of physical prompt), then leave it around for a week to allow students to get their ideas together. Finally, on Friday we would do measuring, calculating, summarizing, checking and reflecting.

I wonder what we can measure next?